
Which States Produce the Most U.S. Senators?
Over the last 100 years Ohio, New York, and Missouri have given birth to the most Senators, while Ohio, Vermont and Mississippi boast the largest percentage of home-born Senators
 It is a political tool used for generations: touting one’s home state credentials in order to make connections – real or superficial – with voters in order to move the needle just a little more with the electorate.
Sometimes the connections are tenuous (“My wife’s grandfather was born here in North Carolina”) and sometimes not (“I was born and raised in Kansas”).
Of course, the number of home-born Senators in a given state is determined by a host of factors, such as differences between states in their willingness to elect ‘outsiders’ (e.g. New York and Hillary Clinton in 2000) as well as trends in population shifts as new people enter or exit the state.
And what state has given birth to the most Senators over the past century?
A Smart Politics review of information culled from the Biographical Directory of the United States Congress finds that more Senators were born in the state of Ohio than any other over the last 100 years.
A total of 43 of the nation’s 879 Senators who have been elected or appointed since popular vote elections were introduced were born in the Buckeye State, or 4.9 percent.
However, no current Senator in the 112th Congress outside of Sherrod Brown and Rob Portman were born in Ohio.
The population of Ohio has ranked between fourth and seventh in the nation during this 100-year span, but is on the decline relative to the nation overall.
 New York has produced the second largest number of U.S. Senators with 37, including nine current members of the nation’s upper legislative chamber: Al Franken (Minnesota), Richard Blumenthal (Connecticut), Barbara Boxer (California), Bob Menendez (New Jersey), Sheldon Whitehouse (Rhode Island), Bernie Sanders (Vermont), Jay Rockefeller (West Virginia), and New York’s Chuck Schumer and Kirsten Gillibrand.
Aside from Illinois at #4 (with 32 Senators) and Pennsylvania at tied for #8 (with 27), several moderately populated states rank in the Top 10.
For example, Missouri has produced the third largest number of Senators over the last 100 years with 35 – including Montana’s Conrad Burns, New Hampshire’s Jeanne Shaheen, Virginia’s Jim Webb, and current Show Me State Senators Claire McCaskill and Roy Blunt.
Missouri was the seventh most populated state when popular vote elections began, but has fallen significantly to just #18 after the 2010 Census.
Also in the Top 10 are Massachusetts at #5 (31 Senators), Kentucky at #6 (30), Iowa at #7 (28), North Carolina at tied for #8 (27), and Indiana and Alabama at #10 (23).
And which states have produced the fewest number of Senators?
Aside from Alaska (#50 with two) and Hawaii (tied for #46 with six) – the two most recent states admitted to the Union in the middle of the 20th Century – New Mexico, Montana, and Washington have given birth to the fewest Senators with six each.
Many other western states appear at the bottom of the list including Arizona and Idaho at tied for #44 (with seven), and Nevada and Wyoming tied for #40 (with eight). New Hampshire and Oklahoma have also yielded only eight Senators during the last century.
States Giving Birth to the Most U.S. Senators Over the Past 100 Years
|
Rank
|
State
|
Home State
|
Exports
|
Total
|
|
1
|
Ohio
|
25
|
18
|
43
|
|
2
|
New York
|
13
|
24
|
37
|
|
3
|
Missouri
|
16
|
19
|
35
|
|
4
|
Illinois
|
17
|
15
|
32
|
|
5
|
Massachusetts
|
14
|
17
|
31
|
|
6
|
Kentucky
|
20
|
10
|
30
|
|
7
|
Iowa
|
13
|
15
|
28
|
|
8
|
North Carolina
|
20
|
7
|
27
|
|
8
|
Pennsylvania
|
13
|
14
|
27
|
|
10
|
Indiana
|
14
|
9
|
23
|
|
10
|
Alabama
|
14
|
9
|
23
|
|
12
|
Georgia
|
14
|
8
|
22
|
|
13
|
Tennessee
|
14
|
6
|
20
|
|
13
|
South Dakota
|
13
|
7
|
20
|
|
15
|
Kansas
|
11
|
8
|
19
|
|
15
|
Minnesota
|
13
|
6
|
19
|
|
17
|
Wisconsin
|
12
|
6
|
18
|
|
17
|
Maryland
|
15
|
3
|
18
|
|
17
|
California
|
10
|
8
|
18
|
|
17
|
Virginia
|
7
|
11
|
18
|
|
21
|
Mississippi
|
9
|
8
|
17
|
|
21
|
Maine
|
11
|
6
|
17
|
|
21
|
South Carolina
|
15
|
2
|
17
|
|
21
|
Oregon
|
14
|
3
|
17
|
|
21
|
Michigan
|
10
|
7
|
17
|
|
21
|
Nebraska
|
13
|
4
|
17
|
|
21
|
New Jersey
|
13
|
4
|
17
|
|
28
|
Vermont
|
14
|
2
|
16
|
|
28
|
Louisiana
|
14
|
2
|
16
|
|
28
|
Texas
|
12
|
4
|
16
|
|
28
|
Connecticut
|
11
|
5
|
16
|
|
32
|
West Virginia
|
10
|
5
|
15
|
|
33
|
Utah
|
8
|
4
|
12
|
|
34
|
Rhode Island
|
9
|
2
|
11
|
|
35
|
North Dakota
|
9
|
0
|
9
|
|
35
|
Arkansas
|
9
|
0
|
9
|
|
35
|
Delaware
|
9
|
0
|
9
|
|
35
|
Florida
|
8
|
1
|
9
|
|
35
|
Colorado
|
7
|
2
|
9
|
|
40
|
New Hampshire
|
8
|
0
|
8
|
|
40
|
Oklahoma
|
6
|
2
|
8
|
|
40
|
Nevada
|
6
|
2
|
8
|
|
40
|
Wyoming
|
6
|
2
|
8
|
|
44
|
Idaho
|
7
|
0
|
7
|
|
44
|
Arizona
|
3
|
4
|
7
|
|
46
|
Hawaii
|
4
|
2
|
6
|
|
46
|
New Mexico
|
5
|
1
|
6
|
|
46
|
Montana
|
4
|
2
|
6
|
|
46
|
Washington
|
3
|
3
|
6
|
|
50
|
Alaska
|
2
|
0
|
2
|
Data compiled by Smart Politics from the Biographical Directory of the United States Congress. Includes those Senators elected and appointed since popular vote elections were introduced in each state.
Senatorial ‘Exports’
However, because some states have a disproportionately higher turnover in Senate seats (which, for some states, inflates their number of home born Senators), Smart Politics also examined which states have “exported” the largest number of U.S. Senators – those who have gone on to serve as Senators of other states.
For example, 10 states have had 21 or more Senators during the last century while eight have had 13 or fewer.
Topping the list is New York, which has exported 24 Senators to other states over the last 100 years.
Senators from 16 different states were born in New York over the last century, including three each in Connecticut, Minnesota, and New Jersey.
This should not be too surprising considering the Empire State was the most populous state in the nation when popular vote elections were introduced until the 1970 Census when it was eclipsed by California.
Several Midwestern States also rank among the leaders of Senatorial exports, with Missouri at #2 (with 19), Ohio at #3 (18), Illinois and Iowa tied at #5 (15) and Indiana tied at #10 (9).
Other states rounding out the Top 10 are Massachusetts at #4, which has given birth to 17 Senators of other states, Pennsylvania at #7 (14), Virginia at #8 (11), Kentucky at #9 (10), and Alabama at tied for #10 (9).
Six states have not exported a single Senator to other states over the last 100 years: Alaska, Arkansas, Delaware, Idaho, New Hampshire, and North Dakota.
Two states have exported just one Senator: Florida (Charles Percy of Illinois) and New Mexico (Tim Wirth of Colorado).
Overall, the nation’s 12 midwestern states account for 114 of the 332 Senators who were not born in the state they served over the last century, or 34.3 percent.
The 16 Southern states have given birth to 78 exported Senators (23.5 percent), followed by 74 from the nine Northeastern states (22.3 percent), 33 from the 13 Western states (9.9 percent), 22 from foreign countries (6.6 percent), and 11 from Washington, D.C. (3.3 percent).
Regional ‘Exports’ of U.S. Senators
|
Region
|
#
|
Percent
|
|
Midwest
|
114
|
34.3
|
|
South
|
78
|
23.5
|
|
Northeast
|
74
|
22.3
|
|
West
|
33
|
9.9
|
|
Foreign
|
22
|
6.6
|
|
Washington, D.C.
|
11
|
3.3
|
|
Total
|
332
|
100.0
|
Data compiled by Smart Politics from the Biographical Directory of the United States Congress. Includes those Senators elected and appointed since popular vote elections were introduced in each state.
Foreign Born Senators
As mentioned above, 22 U.S. Senators over the last century were born outside of the United States, or 2.5 percent of the more than 875 that have served during this span.
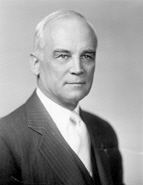
 Minnesota leads the way with three of its U.S. Senators born abroad since 1912: Republicans Knute Nelson (Norway) and Rudy Boshwitz (Germany, pictured) and Farmer-Laborite Magnus Johnson (Sweden).
Colorado and Wyoming have each had two Senators in the last 100 years who were born abroad.
Canada has yielded the largest number of foreign-born Senators with six, followed by Ireland and the United Kingdom with three each, Norway and Germany with two, and Cuba, France, India, Mexico, Panama, and Sweden with one.
Two Senators in the 112th Congress were not born in the United States: Republican John McCain of Arizona (Panama), and Democrat Michael Bennet of Colorado (India).
The Most ‘Territorial’ States
In addition to there not only being a great variation in which states give birth to the most Senators serving other states, there is also a large range in the percentage of Senators born in the states they represent.
Overall, 62 percent of U.S. Senators over the past century represented the state in which they were born.
A total of 547 of the 879 Senators elected and appointed since popular vote elections were introduced 100 years ago were born in the states they served.
Another 310 Senators (35.3 percent) were born in another state or the District of Columbia and 22 Senators (2.5 percent) were born outside of the country.
While every state has imported at least one U.S. Senator born outside its borders, no one can boast the record of Ohio.
Of the 26 Senators from Ohio who were elected or appointed over the last century, only one, future Supreme Court Justice Harold Burton, was born elsewhere. That means 96.2 percent of Ohio Senators were born in-state.
 Burton, a Republican who served less than one term during the second World War, was born in Massachusetts, went to college in Maine, and studied law at Harvard before moving to Cleveland to begin his law practice.
Only two other states have had just one Senator born out of state during the last 100 years – Vermont and Mississippi.
In Vermont, 14 of its 15 Senators over the past 100 years have been born in-state (93.3 percent), with the lone wolf being current Independent Senator (and native New Yorker) Bernie Sanders.
Mississippi has also imported just one Senator over the last century (Democrat John Sharp Williams, who served until 1923), with nine of 10 born in the Magnolia State, or 90 percent.
Regional Differences
Grouping states together by the four U.S. Census regional designations, there is little difference between the percentage of Senators representing the states in which they were born across the Midwest (69.7 percent), the South (69.0 percent), and the Northeast (67.1 percent).
However, the vast majority of Senators representing Western states during this 100-year span were born elsewhere, with just 79 out of 199 Senators representing their birth state (39.7 percent).
Percentage of Senators Representing Birth State by Region Over the Past Century
|
Region
|
In-State
|
Out of State
|
Total
|
% In-State
|
|
Midwest
|
166
|
72
|
238
|
69.7
|
|
South
|
196
|
88
|
284
|
69.0
|
|
Northeast
|
106
|
52
|
158
|
67.1
|
|
West
|
79
|
120
|
199
|
39.7
|
|
Total
|
547
|
332
|
879
|
62.2
|
Data compiled by Smart Politics from the Biographical Directory of the United States Congress. Includes those Senators elected and appointed since popular vote elections were introduced in each state.
Overall, southern states dominate the top of the list and own half of the Top 10 slots of states with the largest percentage of home born Senators.
In addition to Mississippi, Louisiana comes in at #4 (87.5 percent, 14 of 16) with North Carolina (20 of 24), Maryland (15 of 18), and South Carolina (15 of 18) all tied for #7 at 83.3 percent.
Other states in the Top 10 are Wisconsin at #5 (85.7 percent, 12 of 14), Maine at #6 (84.6 percent, 11 of 13), and Massachusetts at #10 (82.4 percent, 14 of 17).
The states with the smallest percentage of homegrown Senators are all from the Western region of the country – holding each of the bottom nine slots.
This, of course, makes intuitive sense as most of these states achieved statehood in the latter parts of the 19th Century (Colorado, Montana, Washington, Idaho, Wyoming) or early to mid 20th Century (New Mexico, Arizona, Alaska, Hawaii).
As a result, many of these states were thinly settled 100 years ago and have continually surged in population over the decades – thus creating a relatively lower pool of in-state candidates with the heavy influx of new residents.
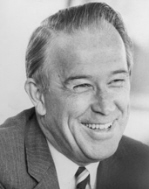 The state with the lowest percentage of homegrown Senators is Washington with just three of 16 born in the Evergreen State, or 18.8 percent.
Only former Democratic Senator Scoop Jackson (pictured), Republican Daniel Evans, and current Senator Patty Murray were born in-state. (Maria Cantwell is from Indiana).
Coming in next to last at #49 is Colorado (28.0 percent, 7 of 25 Senators), followed by Alaska at #48 (28.6 percent, 2 of 7), Arizona at #47 (30.0 percent, 3 of 10), Montana at #46 (30.8 percent, 4 of 13), Wyoming and Nevada at #44 (31.6 percent, 6 of 19 each), New Mexico at #43 (33.3 percent, 5 of 15), and Idaho at #42 (35.0 percent, 7 of 20).
The only non-western state to make the Bottom 10 was Oklahoma, at #41 (35.3 percent, 6 of 17).
However, a few western states do not fall into this general regional pattern, with three ranking among the Top 20 and well above the national average of 62 percent: Hawaii tied for #11 (80.0 percent, 4 of 5), Utah at #18 (72.7 percent, 8 of 11), and Oregon at #20 (70.0 percent, 14 of 20).
Current Delegation
Despite increased mobility in the United States, the current 100 Senators in D.C. are nearly as likely to be serving their birth state – 59 percent, or 59 of 100 Senators – as former Senators who have served over the past century – 62.6 percent (488 of 779):
· 19 state delegations currently have two home-grown Senators: Alabama, Alaska, Florida, Hawaii, Illinois, Iowa, Kansas, Maine, Maryland, Michigan, Mississippi, Missouri, Montana, New York, North Dakota, Ohio, South Carolina, South Dakota, and Texas.
· 21 state delegations have one home-born and one ‘imported’ Senator: Arkansas, California, Connecticut, Georgia, Idaho, Indiana, Louisiana, Minnesota, Nebraska, Nevada, New Hampshire, New Jersey, North Carolina, Oregon, Pennsylvania, Rhode Island, Tennessee, Vermont, Washington, West Virginia, and Wisconsin.
· 10 state delegations have imported both of their Senators from other states (or countries): Arizona, Colorado, Delaware, Kentucky, Massachusetts, New Mexico, Oklahoma, Utah, Virginia, and Wyoming.
By Party
There were no significant regional differences between political parties on this dimension.
In total, 64.4 percent of Democrats were born in-state (298 of 463) compared to 59.7 percent of Republicans (244 of 409) and 57.1 percent of third parties (4 of 7).
For the 112th Congress, 55 percent of Republicans were born in the state they represent (26 of 47) compared to 63 percent of Democrats (32 of 51) and 50% of independents (1 of 2).
Percentage of Home Grown U.S. Senators by State Over the Last 100 Years
|
Rank
|
State
|
In-State
|
Out of State
|
Foreign
|
% In-State
|
|
1
|
Ohio
|
25
|
1
|
0
|
96.2
|
|
2
|
Vermont
|
14
|
1
|
0
|
93.3
|
|
3
|
Mississippi
|
9
|
1
|
0
|
90.0
|
|
4
|
Louisiana
|
14
|
2
|
0
|
87.5
|
|
5
|
Wisconsin
|
12
|
2
|
0
|
85.7
|
|
6
|
Maine
|
11
|
2
|
0
|
84.6
|
|
7
|
Maryland
|
15
|
3
|
0
|
83.3
|
|
7
|
South Carolina
|
15
|
3
|
0
|
83.3
|
|
9
|
North Carolina
|
20
|
4
|
0
|
83.3
|
|
10
|
Massachusetts
|
14
|
3
|
0
|
82.4
|
|
11
|
Kentucky
|
20
|
5
|
0
|
80.0
|
|
11
|
Hawaii
|
4
|
1
|
0
|
80.0
|
|
13
|
Indiana
|
14
|
3
|
1
|
77.8
|
|
13
|
Alabama
|
14
|
4
|
0
|
77.8
|
|
13
|
Georgia
|
14
|
4
|
0
|
77.8
|
|
16
|
Texas
|
12
|
4
|
0
|
75.0
|
|
17
|
Illinois
|
17
|
6
|
0
|
73.9
|
|
18
|
Utah
|
8
|
3
|
0
|
72.7
|
|
19
|
New York
|
13
|
4
|
1
|
72.2
|
|
20
|
Oregon
|
14
|
6
|
0
|
70.0
|
|
21
|
Missouri
|
16
|
7
|
0
|
69.6
|
|
22
|
Rhode Island
|
9
|
3
|
1
|
69.2
|
|
23
|
Kansas
|
11
|
5
|
0
|
68.8
|
|
24
|
Tennessee
|
14
|
7
|
0
|
66.7
|
|
25
|
Iowa
|
13
|
7
|
0
|
65.0
|
|
25
|
South Dakota
|
13
|
7
|
0
|
65.0
|
|
25
|
Pennsylvania
|
13
|
6
|
1
|
65.0
|
|
28
|
Michigan
|
10
|
5
|
1
|
62.5
|
|
29
|
North Dakota
|
9
|
5
|
1
|
60.0
|
|
30
|
Nebraska
|
13
|
9
|
0
|
59.1
|
|
31
|
West Virginia
|
10
|
7
|
0
|
58.8
|
|
32
|
Connecticut
|
11
|
7
|
1
|
57.9
|
|
33
|
New Jersey
|
13
|
9
|
1
|
56.5
|
|
34
|
Arkansas
|
9
|
7
|
0
|
56.3
|
|
35
|
Delaware
|
9
|
8
|
0
|
52.9
|
|
36
|
California
|
10
|
8
|
1
|
52.6
|
|
37
|
Minnesota
|
13
|
9
|
3
|
52.0
|
|
38
|
Virginia
|
7
|
8
|
0
|
46.7
|
|
39
|
Florida
|
8
|
9
|
1
|
44.4
|
|
40
|
New Hampshire
|
8
|
11
|
1
|
40.0
|
|
41
|
Oklahoma
|
6
|
11
|
0
|
35.3
|
|
42
|
Idaho
|
7
|
12
|
1
|
35.0
|
|
43
|
New Mexico
|
5
|
9
|
1
|
33.3
|
|
44
|
Nevada
|
6
|
13
|
0
|
31.6
|
|
44
|
Wyoming
|
6
|
11
|
2
|
31.6
|
|
46
|
Montana
|
4
|
8
|
1
|
30.8
|
|
47
|
Arizona
|
3
|
6
|
1
|
30.0
|
|
48
|
Alaska
|
2
|
5
|
0
|
28.6
|
|
49
|
Colorado
|
7
|
16
|
2
|
28.0
|
|
50
|
Washington
|
3
|
13
|
0
|
18.8
|
|
|
Total
|
547
|
310
|
22
|
62.2
|
Data compiled by Smart Politics from the Biographical Directory of the United States Congress. Includes those Senators elected and appointed since popular vote elections were introduced in each state.
Follow Smart Politics on Twitter.
That is a very detailed and interesting analysis.
It may be a reasonable hypothesis that what are now the fastest growing states will be contributing a disproportionately larger share of senators, relative to the 2 senators per state delegation, for the next decades.
And support for that was already found in that analysis, as Ohio’s contribution still ranks first but has been declining as the state’s population has been shrinking.
what current us senator was born in alabama, does not represent that state, and was present at martin luther kings 1963 i have a dream speech?
On August 28, 1963, Martin Luther King Jr., delivered a speech to a massive group of civil rights marchers gathered around the Lincoln memorial in Washington DC. The March on Washington for Jobs and Freedom brought together the nations most prominent civil rights leaders, along with tens of thousands of marchers, to press the United States government for equality. The culmination of this event was the influential and most memorable speech of Dr. King’s career. Popularly known as the “I have a Dream” speech, the words of Martin Luther King, Jr. influenced the Federal govern